





Metals and Minerals Price Update - Feb 2018
Metals and minerals prices hit their lowest levels of the current cycle in January 2016 but rapid increases have since been seen in various commodities. The sharpest metals price rises since January 2016 have been seen in zinc and iron ore, with copper, lead, nickel and tin also performing strongly.
By November 2017, the World Bank commodity price index for metals and minerals had risen 50% to $83 from January 2016 lows of $55. Data for December 2017 and January 2018 suggests a continuation of this trend which, along with forecasts of a sustained period of global growth, has led to a positive outlook for the mining industry.
Global output is estimated to have grown by 3.7% in 2017, with further increases to 3.9% forecast in 2018 and 2019. China remains by far the leading consumer of refined metals, accounting for more than half of world consumption, and is predicted to see growth of 6.6% in 2018. Goldman Sachs analysts recently noted that:
"The environment for investing in commodities is the best since 2004-2008".
Data from the recent past suggests that, barring any unexpected global economic uncertainty or a pronounced slowdown in China, metals and minerals prices will continue to rise from their current levels. Since 2000, peaks in the World Bank commodity price index were seen in March 2008 ($126) and April 2011 ($124), suggesting that a further 50% growth from November 2017 levels is possible.
World Bank Metals and Minerals Index
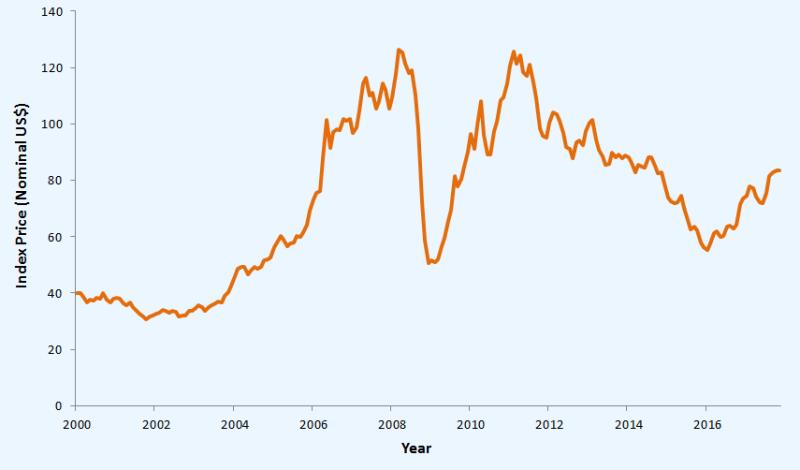
It must be noted, however, that growth to 2008 and 2011 levels was largely dependent on China’s demand for raw materials, which has since slowed. Assuming that demand from China doesn't reach previous levels, other drivers such as demand from emerging economies and the electric vehicle market will need to fill this gap if the index is to hit these highs in the coming years.
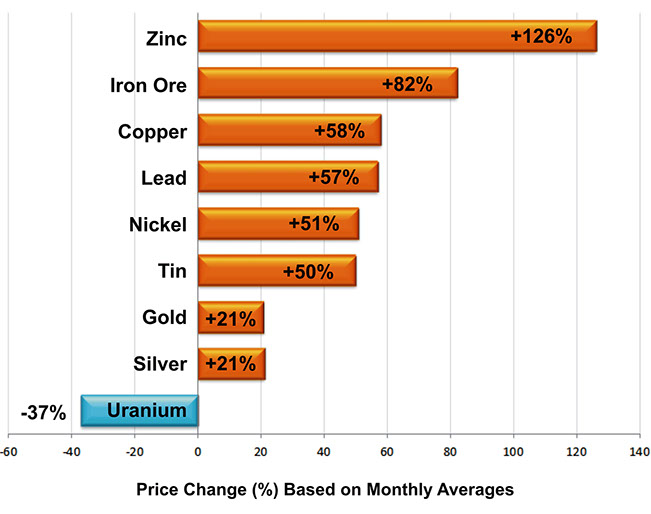
Metals and Minerals Price Changes -
Jan 2016 to Jan 2018
The strongest performer from January 2016 to January 2018 has been zinc due to forecast supply shortages. While the iron ore price fell slightly in 2017, it has still seen one of the sharpest price rises since January 2016 thanks to a gain of 91% in 2016. Other strong performers are copper, lead, nickel and tin, while gold and silver have also risen by more than 20% in the 2 year period.
Battery metals such as lithium, graphite and cobalt have also been among the top performers in recent years, with prices being driven up by the predicted increase in the size of the electric vehicle market. UBS forecasts that by 2025, 1 of every 6 cars sold will be electric. This will have a large impact on the demand for the battery metals - for example, global lithium demand is expected to increase by 190% from 184,000 tonnes in 2015, to 534,000 tonnes in 2025.
See below for further information on selected metals and see ACA Howe's project location map for details of our experience in the exploration, mining and processing of a wide range of metals and minerals or Contact Us for further information.
Zinc
Jan 2016 Average = $1,520/mt
Jan 2018 Average = $3,442/mt
The biggest gains since market lows of January 2016 have been made in zinc, with an increase of 126%. In January 2018, the price of zinc hit its highest level since 2007, averaging $3,442 per tonne. Analysts at Wood Mackenzie anticipate that the price of zinc will exceed $4,000 per tonne by the end of the year.
Drivers for the sharp increase in the price of zinc since January 2016 include scheduled mine closures, environmental policy in China and the decision by Glencore to halt mine production.
Jan 2016 - Jan 2018 % Change
+126%
Iron Ore
Jan 2016 Average = $42/dmtu
Jan 2018 Average = $76/dmtu
Having made gains of 91% in 2016, the iron ore spot price fell back slightly in 2017, although has still increased by 82% overall. The average price in January 2018 was $76 per dmtu.
Wood Mackenzie has forecast an average of $63 per tonne in 2018, while others expect the price to remain at around the current level.
Jan 2016 - Jan 2018 % Change
+82%
Copper
Jan 2016 Average = $4,472/mt
Jan 2018 Average = $7,066/mt
Copper prices reached their highest average monthly level in 3 years in December 2017, having gained 21% in the year. Gains from January 2016 to January 2018 total 58%.
Drivers for the increase in price are a forecast supply deficit by 2019, increased demand predicted with the growth of the electric vehicle market and concerns on the effect of contract negotiations on production - potentially affecting 25% of global mine supply (Citibank).
Jan 2016 - Jan 2018 % Change
+58%
Lead
Jan 2016 Average = $1,646/mt
Jan 2018 Average = $2,584/mt
In October 2017, the lead price passed $2,600 per tonne, the highest level since 2011. The price increase since January 2016 is 57%, almost on par with copper.
Analysts’ views on the lead price going forward are varied, although overall it is expected to stay reasonably stable.
Jan 2016 - Jan 2018 % Change
+57%
Nickel
Jan 2016 Average = $8,507/mt
Jan 2018 Average = $12,865/mt
In January 2018, the nickel price reached its highest level since May 2015. Since January 2016, the price has increased by 51%.
Analysts at Wood Mackenzie forecast a deficit of between 80,000-90,000 tonnes in 2018. In addition, nickel is a component of electric vehicle batteries and demand from this market is expected to rise from 60,000-80,000 tonnes in 2018 to 220,000 tonnes in 2025.
Jan 2016 - Jan 2018 % Change
+51%
Jan 2016 - Jan 2018 % Change
+21%
Gold
Jan 2016 Average = $1,098/oz
Jan 2018 Average = $1,331/oz
The gold price has seen gains in both 2016 and 2017, with an overall rise of 21% since January 2016.
Events in North Korea and Syria, global growth and economic policy could all have an impact on the gold price in the coming year. The LBMA reports that analyst forecasts for 2018 are widely spread but that they average $1,318/oz.
See our project location map for details of ACA Howe International's experience in the exploration, mining and processing of a wide range of metals and minerals or contact us for further information.
Uranium
Jan 2016 Average = $35/lb
Jan 2018 Average = $22/lb
The fall in the uranium spot price in 2016 and 2017 totals 37% at a time when other metals and minerals have been on the up. The price has been negatively impacted by over-supply caused largely by the temporary shutdown of Japanese reactors in the wake of the incident at Fukushima.
However, there has been recent optimism that the uranium price has now bottomed after both Cameco and KazAtomProm made cuts to their production, which previously accounted for a combined 38% globally.
Jan 2016 - Jan 2018 % Change
-37%
